Question 2
HOTSPOT -
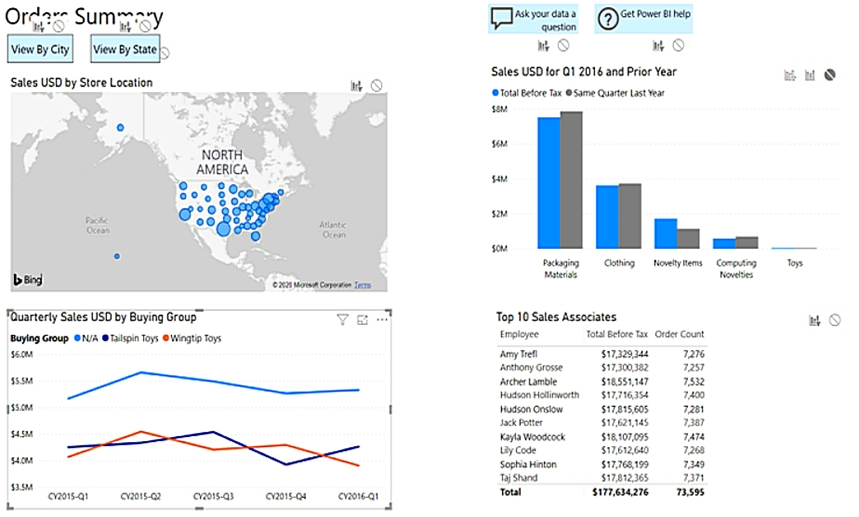
You have a report page that contains the visuals shown in the following exhibit.
Use the drop-down menus to select the answer choice that completes each statement based on the information presented in the graphic.
NOTE: Each correct selection is worth one point.
Hot Area:
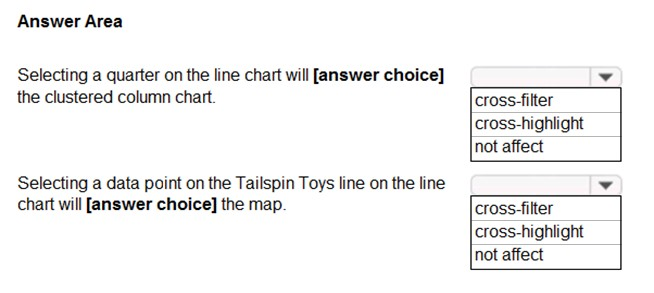
Answer :

Explanation:
Box 1: cross-filter -
By default, selecting a data point in one visual on a report page will cross-filter or cross-highlight the other visuals on the page.
Box 2: cross-highlight -
Example:
By default, selecting a data point in one visual on a report page will cross-filter or cross-highlight the other visuals on the page.

1. Let's see what happens when we select Moderation.
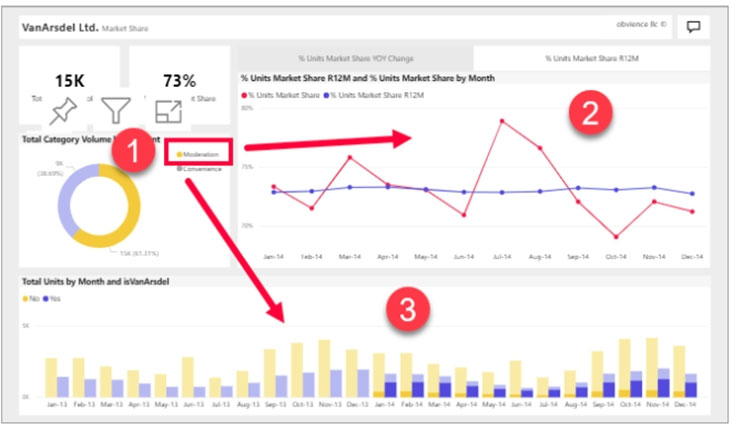
2. Cross-filtering removes data that doesn't apply. Selecting Moderation in the doughnut chart cross-filters the line chart. The line chart now only displays data points for the Moderation segment.
3. Cross-highlighting retains all the original data points but dims the portion that does not apply to your selection. Selecting Moderation in the doughnut chart cross-highlights the column chart. The column chart dims all the data that applies to the Convenience segment and highlights all the data that applies to the
Moderation segment.
Reference:
https://docs.microsoft.com/en-us/power-bi/consumer/end-user-interactions

Comments
Post a Comment